Creation of Custom Indicators
When creating a trading strategy a developer often faces the necessity to draw graphically in a security window a certain dependence calculated by a user (programmer). For this purpose MQL4 offers the possibility of creating custom indicators.
Custom Indicator is an application program coded in
MQL4; it is basically intended for graphical displaying of
preliminarily calculated dependences.
Custom Indicator Structure
Necessity of Buffers
The main principle underlying custom indicators is passing values of indicator arrays to a client terminal (for drawing indicator lines) via exchange buffers.
Buffer is a memory area containing numeric values of an indicator array.
MQL4 standard implies the possibility of drawing up to eight indicator lines using one custom indicator. One indicator array and one buffer are brought into correspondence with each indicator line. Each buffer has its own index. The index of the first buffer is 0, of the second one - 1, and so on, the last one has the index 7. Fig. 115 shows how the information from a custom indicator is passed via buffers to a client terminal for drawing indicator lines.
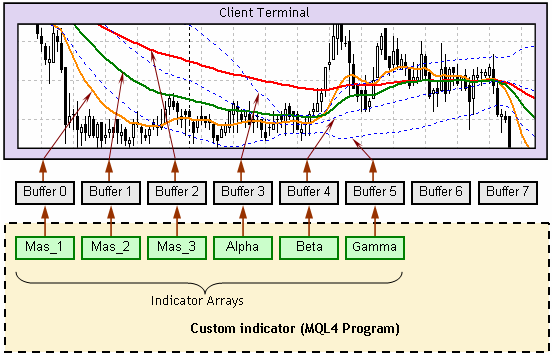
Fig. 115. Passing values of indicator arrays via a buffer to a client terminal.
The general order of building indicator lines is the following:
1. Calculations are conducted in a custom indicator; as a result numeric values are assigned to indicator array elements.
2. Values of indicator array elements are sent to a client terminal via buffers.
3. On the bases of value arrays received from buffers a client terminal displays indicator lines.
Components of a Custom Indicator
Let's analyze a simple custom indicator that shows two lines - one line is build based on maximal bar prices, the second one uses minimal prices.
#property indicator_chart_window
#property indicator_buffers 2
#property indicator_color1 Blue
#property indicator_color2 Red
double Buf_0[],Buf_1[];
int init()
{
SetIndexBuffer(0,Buf_0);
SetIndexStyle (0,DRAW_LINE,STYLE_SOLID,2);
SetIndexBuffer(1,Buf_1);
SetIndexStyle (1,DRAW_LINE,STYLE_DOT,1);
return;
}
int start()
{
int i,
Counted_bars;
Counted_bars=IndicatorCounted();
i=Bars-Counted_bars-1;
while(i>=0)
{
Buf_0[i]=High[i];
Buf_1[i]=Low[i];
i--;
}
return;
}
Let's analyze in details the indicator parts. In any application program written in MQL4 you can indicate setup parameters that provide the correct program servicing by a client terminal. In this example the head program part (see Program Structure) contains several lines with directives #property .
The first directive indicates in what window the client terminal should draw the indicator lines:
#property indicator_chart_window
In MQL4 there are two variants of drawing indicator lines: in the main security window and in a separate window. Main window is the window containing a security chart. In this example parameter indicator_chart_window in #property directory indicates that a client terminal should draw indicator lines in the main window.
The next line shows the number of buffers used in the indicator:
#property indicator_buffers 2
In the analyzed example two indicator lines are drawn. One buffer is assigned to each buffer, so the total number of buffers is two.
The next lines describe colors of the indicator lines.
#property indicator_color1 Blue
#property indicator_color2 Red
Parameters indicator_color1 and indicator_color2 define color setting for corresponding buffers - in this case for buffers with indexes 0 (Blue) and 1 (Red). Note that figures in parameter names
indicator_color1 and indicator_color2 are not buffer indexes. These figures are parts of constant names that are set in accordance with buffers. For each constant color can be set at the discretion of a user.
In the next line indicator arrays are declared:
double Buf_0[],Buf_1[];
The indicator is intended for drawing two indicator lines, so we need to declare two global one-dimension arrays, one for each line. Names of indicator arrays are up to user. In this case array names Buf_0[] and Buf_1[] are used, in other cases other names can be used, for example, Line_1[],Alfa[], Integral[] etc. It is necessary to declare arrays on a global level, because array elements values must be preserved between calls of the special function start().
The described custom indicator is built on the basis of two special functions
-init() and start(). The function init() contains the part of code used on the program only once (see Special functions).
A very important action is performed in the line:
SetIndexBuffer(0,Buf_0);
Using the function SetIndexBuffer() a necessary buffer (in this case with the index 0) is put into correspondence with an array (in this case Buf_0). It means for constructing the first indicator line a client terminal will accept data contained in the array Buf_0 using the zero buffer for it.
Further the line style is defined:
SetIndexStyle (0,DRAW_LINE,STYLE_SOLID,2);
For the zero buffer (0) a client terminal should use the following drawing styles: simple line (DRAW_LINE), solid line (STYLE_SOLID), line width 2.
The next two lines contain settings for the second line:
SetIndexBuffer(1,Buf_1);
SetIndexStyle (1,DRAW_LINE,STYLE_DOT,1);
Thus, according to the code of the special function init() both indicator lines will be drawn in the main security window. The first one will be a solid blue line with the width 2, the second one is a red dotted line ( STYLE_DOT) of a usual width. Indicator lines can be drawn by other styles as well (see Styles of Indicator Lines).
Calculating Values of Indicator Arrays Elements (Be Attentive)
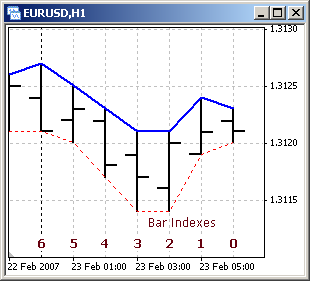
Values of indicator arrays elements are calculated in the special function start(). To understand correctly the contents of start() code pay attention to the order of indexing bars. The section Arrays describes in details the method of indexing arrays-timeseries. According to this method bar indexing starts from zero. The zero bar is a current yet unformed bar. The nearest bar's index is 1. The next one's is 2 and so on.
As new bars appear in a security window, indexes of already formed (history) bars are changed. The new (current, just formed, rightmost) bar gets the zero index, the one to the left of him (that has just fully formed) gets the index 1 and values of indexes of all history bars are also increased by one.
 |
The described method of indexing bars is the only one possible for the whole on-line trading system MetaTrader, and it is taken into account when drawing lines using both technical and custom indicators. |
It was said earlier that indicator lines are constructed on the basis of numeric information contained in indicator arrays. An indicator array contains information about dots coordinates upon which an indicator line is drawn. And the Y coordinate of each dot is the value of an indicator array element, and X coordinate is the value of an indicator array element index. In the analyzed example the first indicator line is drawn using maximal values of bars. Fig, 116 shows this indicator line (of blue color) in a security window, it is built on the basis of the indicator array Buf_0.
|
|
| Index value of indicator array Buf_0 |
Element value of indicator array Buf_0 |
| 0 |
1.3123 |
| 1 |
1.3124 |
| 2 |
1.3121 |
| 3 |
1.3121 |
| 4 |
1.3123 |
| 5 |
1.3125 |
| 6 |
1.3127 |
| ... |
... |
|
Fig. 116. Correspondence of coordinates of an indicator line to values of an indicator array.
Index value of an indicator array is out by a client terminal into correspondence with a bar index - these index values are equal. It must be also taken into account that the process of constructing indicator lines goes on in real time mode under conditions when in a security window new bars appear from time to time. And all history bars are shifted to the left. To have the indicator line drawn correctly (each line dot above its bar) it must also be shifted together with bars. So there is need (technical need) to re-index an indicator array.
The fundamental difference of an indicator array from a usual array is the following:
 |
At the moment when a new bar is created, index values of indicator array elements are automatically changed by the client terminal, namely - value of each indicator array index is increased by one and the indicator array size is increased by one element (with a zero index). |
For example, the zero bar in Fig. 116 (timeframe H1) has the opening time 6:00. At 7:00 a new bar will appear in the security window. The bar opened at 6:00 will automatically get the index 1. To have the indicator line drawn correctly on this bar, the client terminal will change the index of the indicator array element corresponding to the bar opened at 6:00. In the table in Fig. 116 this element is written in the first line. Together with that indexes of all array elements will be increased by the client terminal by one. An the index of the array element corresponding to the bar opened at 6:00 will get the value 1 (before that it was equal to 0). The indicator array will become larger by one element. The index of a new added element will be equal to 0, the value of this element will be a new value reflecting coordinate of the indicator line on a zero bar. This value is calculated in the special function start() on each tick.
Calculations in the special function start() should be conducted so that no extra actions were performed. Before the indicator is attached to a chart, it does not reflect any indicator lines (because values of indicator arrays are not defined yet). That's why at the first start of the special function start() indicator array values must be calculated for all bars, on which the indicator line should be drawn. In the analyzed example these are all bars present on a chart (the initial calculations can be conducted not for all available bars, but for some last part of history; it is described in further examples). Ar all further starts of the special function start() there is no need to calculate values of indicator array for all bars again. These values are already calculated and are contained in the indicator array. It is necessary to calculate the current value of the indicator line only on each new tick of the zero bar.
For the implementation of the described technology there is a very useful standard function in MQL4 - IndicatorCounted() .
Function IndicatorCounted()
int IndicatorCounted()
This function returns the number of bars that have not changed since the last indicator call.
If the indicator has never been attached to a chart, at the first start() execution the value of Counted_bars will be equal to zero:
Counted_bars=IndicatorCounted();
It means the indicator array does not contain any element with earlier predefined value, that is why the whole indicator array must be calculated from beginning to end. The indicator array is calculated from the oldest bar to the zero one. Index of the oldest bar, starting from which calculations must be started, is calculated the following way:
i=Bars-Counted_bars-1;
Suppose at the moment of attaching the indicator there are 300 bars in a chart window. This is the value of the predefined variable Bars. As defined earlier, Counted_bars is equal to 0. So, as a result we obtain that i index of the first uncounted bar (the latest one, starting from which calculations should be conducted) is equal to 299.
All values of indicator array elements are calculated in the loop while():
while(i>=0)
{
Buf_0[i] = High[i];
Buf_1[i] = Low[i];
i--;
}
While i is within the range from the first uncounted bar (299) to the current one (0) inclusively, values of indicator array elements are calculated for both indicator lines. Note, missing values of indicator array elements are calculated during one (the first) start of the special function start(). During calculations the client terminal remembers elements, for which values were calculated. The last iteration in while() is performed when i is equal to 0, i.e. values of indicator arrays are calculated for the zero bar. When the loop is over, the special function start() finishes its execution and control is passed to the client terminal. The client terminal in its turn will draw all (in this case two) indicator lines in accordance with the calculated values of array elements.
On the next tick start() will be started by the client terminal again. Further actions will depend on the situation (we will continue analyzing the example for 300 bars).
Variant 1. A new tick comes during the formation of the current zero bar (the most common situation).
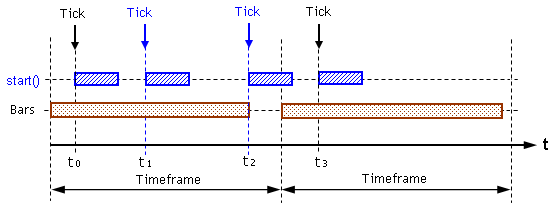
Fig. 117. The processed tick belongs to the current bar.
Fig. 117 shows two ticks received by the terminal at moments of time t 1 and t 2. The analyzed situation will be the same for both ticks. Let's trace the execution of start() that was launched at the moment t 2. During the execution of the function start() the following line will be executed:
Counted_bars=IndicatorCounted();
IndicatorCounted() will return the value 299, i.e. since the last start() call 299 previous bars were not changed. As a result i index value will be equal to 0 (300-299-1):
i=Bars-Counted_bars-1;
It means in the next while() loop the values of array elements with the zero index will be calculated. In other words, the new position of an indicator line on the zero bar will be calculated. When the cycle is finished, start() will stop executing and will pass control to the client terminal.
Variant 2. A new tick is the first tick of a zero bar (happens from time to time).
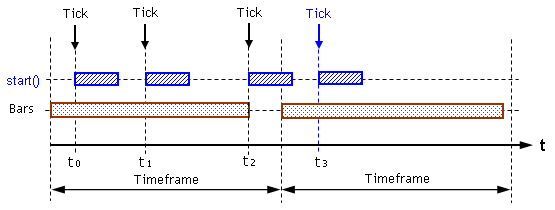
Fig. 118. The processed tick is the first tick of a new zero bar.
In this case the fact of appearance of a new bar is important. Before control is passed to the special function start(), client terminal will draw again all bars present in the security window and re-index all declared indicator arrays (set in correspondence with buffers). Besides, client terminal will remember that there are already 301 bars, not 300 in a chart window.
Fig. 118 contains situation when on the last tick of the previous bar (at the moment t 2) the function start() was successfully started and executed. That's why, though now the first bar (with index 1) finished at the moment t 2 was calculated by the indicator, function IndicatorCounted() will return value that was on the previous bar, i.e. 299:
Counted_bars=IndicatorCounted();
In the next line index i will be calculated, in this case for the first tick of a new bar it will be equal to 1 (301-299-1):
i=Bars-Counted_bars-1;
It means calculation of indicator array values in while() loop at the appearance of a new bar will be performed both for the last bar and for the new zero bar. A little earlier during re-indexation of indicator arrays the client terminal increased sizes of these arrays. Values of array elements with zero indexes were not defined before the calculations in the loop. During calculations in the loop these elements get some values. When calculations in start() are over, control is returned to the client terminal. After that the client terminal will draw indicator lines on the zero bar based on just calculated values of array elements with zero indexes.
Variant 3. A new tick is the first tick of a new zero bar, but the last but one tick is not processed (rare case).
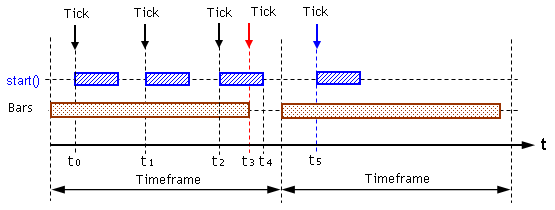
Fig. 119. Not all ticks of the previous bar were processed.
Fig. 119 shows the situation when start() was launched on the first tick of a new bar at the moment t 5. Previous time this function was started at the moment t 2. Tick that came to the terminal at the moment t 3 (red arrow) was not processed by the indicator. This happened because start() execution time t 2 - t 4 is larger than the interval between ticks t 2 - t 3. This fact will be detected by the client terminal during the execution of start() launched at the moment t 5. During calculations in the line:
Counted_bars=IndicatorCounted();
IndicatorCounted() will return the value 299 (!). This value is true - from the moment of the last indicator call 299 bars were not changed after (now already) 301. That is why the calculated index of the first (leftmost) bar, from which calculations of array element values must be started, will be equal to 1 (301-299-1):
i=Bars-Counted_bars-1;
it means during while() execution two iterations will be performed. During the first one values of array elements with the index i = 1 will be calculated, i.e. Buf_0[1] and Buf_1[1]. Not, by the moment calculations start, bars and indicator arrays are already re-indexed by the client terminal (because a new bar started, between starts of the special function start()). That is why calculations for elements of arrays with index 1 will be calculated on the basis of array-timeseries (maximal and minimal values of a bar price) also with the index 1:
while(i>=0)
{
Buf_0[i] = High[i];
Buf_1[i] = Low[i];
i--;
}
During the second iteration of while() values for elements with zero indexes, i.e. for the zero bar, is calculated on the basis of last known values of arrays-timeseries.
|
Using of the described technology for the calculation of custom indicators allows, first, to guarantee calculation of values of all indicator array elements irrespective of the specific nature of tick history, and second, to conduct calculations only for uncounted bars, i.e. use economically calculating resources. |
Not, a bar is considered uncounted if calculation of element values of an indicator arrays at least for one last tick of the bar is not performed.
Starting the custom indicator
userindicator.mq4 in a chart window you will see two lines - a thick blue line built upon bar maximums and a dotted red line built upon its minimums (Fig. 120).
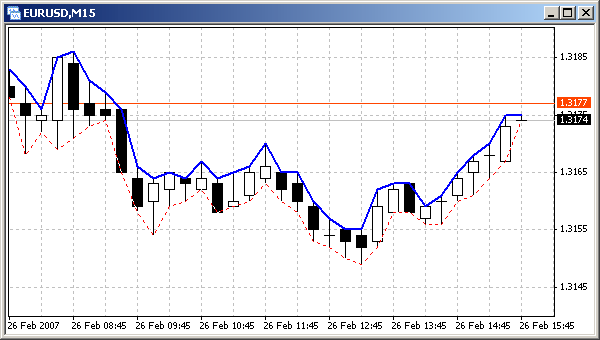
Fig. 120. Two indicator lines in a security window, built by the indicator userindicator.mq4.
It should be noted, that one can built a custom indicator, indicator lines of which would coincide with the lines of an analogous technical indicator. It can be easily done if as calculation formulas in the custom indicator, the same formulas as in the technical indicator are used. To illustrate this let's improve the program code analyzed in the previous example. Let the indicator draw lines upon average values of maximums and minimums of several last bars. It is easy to conduct necessary calculations: we simply need to find average values of arrays-timeseries elements. For example, value of an indicator array with the index 3 (i.e. indicator line coordinate for the third bar) on the basis of the last five maximums is calculated the following way:
Buf_0[3] = ( High[3] + High[4] + High[5] + High[6] + High[7] ) / 5
Analogous calculations can be performed for an indicator lines built upon minimums.
 |
Example of a simple custom indicator
averagevalue.mq4. Indicator lines are built upon average minimal and maximal values of N bars. |
#property indicator_chart_window
#property indicator_buffers 2
#property indicator_color1 Blue
#property indicator_color2 Red
extern int Aver_Bars=5;
double Buf_0[],Buf_1[];
int init()
{
SetIndexBuffer(0,Buf_0);
SetIndexStyle (0,DRAW_LINE,STYLE_SOLID,2);
SetIndexBuffer(1,Buf_1);
SetIndexStyle (1,DRAW_LINE,STYLE_DOT,1);
return;
}
int start()
{
int i,
n,
Counted_bars;
double
Sum_H,
Sum_L;
Counted_bars=IndicatorCounted();
i=Bars-Counted_bars-1;
while(i>=0)
{
Sum_H=0;
Sum_L=0;
for(n=i;n<=i+Aver_Bars-1;n++)
{
Sum_H=Sum_H + High[n];
Sum_L=Sum_L + Low[n];
}
Buf_0[i]=Sum_H/Aver_Bars;
Buf_1[i]=Sum_L/Aver_Bars;
i--;
}
return;
}
In this example there is an external variable Aver_Bars. Using this variable a user can indicate the number of bars, for which an average value is calculated. In start()this value is used for the calculation of an average value. In the loop 'for' the sum of maximal and minimal values is calculated for the number of bars corresponding to the value of the variable Aver_Bars. In the next two program lines values of indicator array elements are calculated for indicator lines corresponding to minimal and maximal values.
The averaging method used here is also applied for calculations in the technical indicator Moving Average. If we attach the analyzed custom indicator averagevalue.mq4 and the technical indicator Moving Average, we will see three indicator lines. If the same period of averaging is set up for both indicators, Moving Average line will coincide with one of the custom indicator lines (for this purpose parameters described in Fig. 121 must be specified in the technical indicator settings).
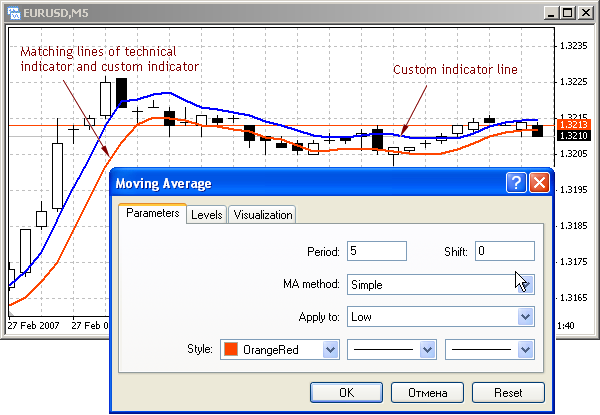
Fig. 121. Coincident lines of a technical indicator and a custom indicator (red line).
Thus, using technical indicator a user can construct the reflection of any regularities necessary in practical work.
Custom Indicator Options
Drawing Indicator Lines in Separate Windows
MQL4 offers a large service for constructing custom indicators which makes using them very convenient. In particular, indicator lines can be drawn in a separate window. This is convenient when absolute values of the indicator line amplitude is substantially smaller (or larger) than security prices. For example, if we are interested in the difference between average values of bar maximums and minimums in a certain historic interval, depending on timeframe this value will be equal to approximately from 0 to 50 points (for example, for M15). It is not difficult to build an indicator line, but in a security window this line will be drawn in the range 0 - 50 points of a security price, i.e. substantially lower than the chart area reflected on the screen. It is very inconvenient.
To draw indicator lines in a separate window (which is in the lower part of a security window), in the directive #property (at the program beginning) parameter indicator_separate_window must be specified:
#property indicator_separate_window
At the moment when such an indicator is attached to a security window, client terminal creates a separate window below a chart, in which indicator lines calculated in the indicator will be drawn. Depending on color settings and types of indicator lines they will be drawn in this or that style.
Limiting Calculation History
In most cases indicator lines contain useful information only in the most recent history. The part of indicator lines built upon old bars (for example, 1 month old minute timeframe) can hardly be considered useful for making trade decisions. Besides, if there are a lot of bars in a chart window, time invested into the calculation and drawing of indicator lines is unreasonably large. This may be critical in program debugging, when a program is often compiled and then started. That is why it is necessary to conduct calculations not for the whole history, but for the limited part of the most recent bar history.
For this purpose an external variable history is used in the following program. Value of this variable is taken into account when calculating index of the first (leftmost) bar, starting from which elements of indicator arrays must be calculated.
i=Bars-Counted_bars-1;
if (i>History-1)
i=History-1;
Further calculations in while() loop will be conducted for the number of recent history bars not larger than History value. Note, the analyzed method of limiting a calculation history concerns only the part of calculations that are conducted in the first start of the special function start(). Further, when new bars appear, new parts of indicator lines will be added in the right part, while the image in the left part will be preserved. Thus the indicator line length will be increased during the whole indicator operation time. Common value of History parameter is considered approximately 5000 bars.
|
Example of a simple custom indicator
separatewindow.mq4. Indicator lines are drawn in a separate window. |
#property indicator_separate_window
#property indicator_buffers 1
#property indicator_color1 Blue
#property indicator_color2 Red
extern int History =50;
extern int Aver_Bars=5;
double Buf_0[];
int init()
{
SetIndexBuffer(0,Buf_0);
SetIndexStyle (0,DRAW_LINE,STYLE_SOLID,2);
return;
}
int start()
{
int i,
n,
Counted_bars;
double
Sum_H,
Sum_L;
Counted_bars=IndicatorCounted();
i=Bars-Counted_bars-1;
if (i>History-1)
i=History-1;
while(i>=0)
{
Sum_H=0;
Sum_L=0;
for(n=i;n<=i+Aver_Bars-1;n++)
{
Sum_H=Sum_H + High[n];
Sum_L=Sum_L + Low[n];
}
Buf_0[i]=(Sum_H-Sum_L)/Aver_Bars;
i--;
}
return;
}
Similar calculation of an indicator line is performed in the technical indicator AverageTrue
Range. Fig. 122 shows an indicator line constructed by the custom indicator separatewindow.mq4 in a separate window and an indicator line constructed by ATR in another window. In this case lines are fully identical because period of averaging is the same for both indicators - 5. If this parameter is changed in any of the indicators, the corresponding indicator line will also change.
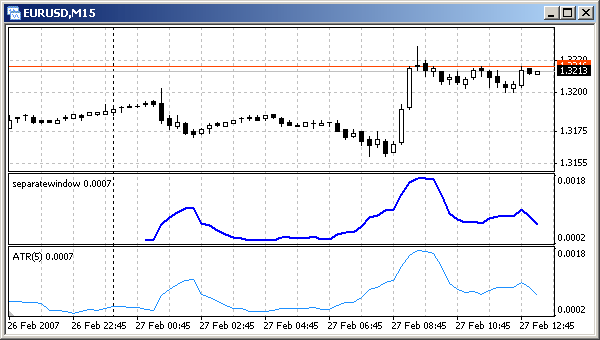
Fig. 122. drawing a custom indicator line in a separate window.
Identical lines of a technical indicator (ATR) and a custom indicator (separatewindow.mq4).
It is also evident that custom indicator line is constructed not for the whole screen width, but for 50 latest bars as specified in the external variable History. If a trader needs to use larger history interval, value of the external variable can be easily changed via the custom indicator settings window.
Fig. 123 shows a security window, in which the indicator line us drawn in another style - as a histogram. For getting such a result one line was changed in the program code
separatewindow.mq4 - other line styles are indicated:
SetIndexStyle (0,DRAW_HISTOGRAM);
All other code parts are unchanged.
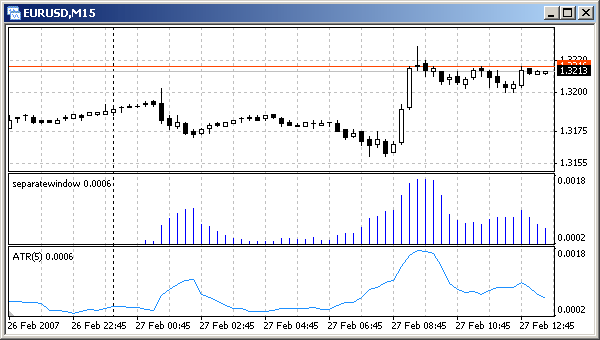
Fig. 123. Drawing custom indicator line in a separate window (histogram).
Similarity of drawings of a technical indicator (ATR) and a custom indicator (separatewindow.mq4).
Shifting Indicator Lines Vertically and Horizontally
In some cases it is necessary to shift an indicator line. It can be easily done by MQL4 means. Let's analyze an example, in which position of indicator lines in a security window are calculated in accordance with values specified by a user.
|
Example of a custom indicator
displacement.mq4. Shifting indicator lines horizontally and vertically. |
#property indicator_chart_window
#property indicator_buffers 3
#property indicator_color1 Red
#property indicator_color2 Blue
#property indicator_color3 Green
extern int History =500;
extern int Aver_Bars=5;
extern int Left_Right= 5;
extern int Up_Down =25;
double Line_0[],Line_1[],Line_2[];
int init()
{
SetIndexBuffer(0,Line_0);
SetIndexStyle (0,DRAW_LINE,STYLE_SOLID,2);
SetIndexBuffer(1,Line_1);
SetIndexStyle (1,DRAW_LINE,STYLE_DOT,1);
SetIndexBuffer(2,Line_2);
SetIndexStyle (2,DRAW_LINE,STYLE_DOT,1);
return;
}
int start()
{
int i,
n,
k,
Counted_bars;
double
Sum;
Counted_bars=IndicatorCounted();
i=Bars-Counted_bars-1;
if (i>History-1)
i=History-1;
while(i>=0)
{
Sum=0;
for(n=i;n<=i+Aver_Bars-1;n++)
Sum=Sum + High[n]+Low[n];
k=i+Left_Right;
Line_0[k]= Sum/2/Aver_Bars;
Line_1[k]= Line_0[k]+Up_Down*Point;
Line_2[k]= Line_0[k]-Up_Down*Point;
i--;
}
return;
}
For adjusting lines shift in a chart, there are two external variables - Left_Right for horizontal shift of all lines and Up_Down for shifting two dotted lines vertically.
extern int Left_Right= 5;
extern int Up_Down = 25;
The algorithm used for calculating values of corresponding array elements is based on very simple rules:
- for shifting a line horizontally, assign the calculated value to an array element, the index of which is larger by Left_Right (for shifting to the right and less for shifting to the right) than the index of a bar, for which calculations are conducted;
- for shifting a line vertically, Up_Down*Point must be added (for shifting upwards or detracted for shifting downwards) to each value of an indicator array characterizing initial line position;
In the analyzed example indexes are calculated in the line:
k = i+Left_Right;
Here i is the index of a bar, for which calculations are performed, k is an index of an indicator array element. Red indicator line displayed by the client terminal based on the indicator array Line_0[] is shifted to the left by 5 bars (according to custom settings, see Fig. 124) from the initial line. In this case the initial line is a Moving Average with the period of averaging equal to 5; the formula of MA calculation is (High[i]+Low[i])/2 .
Line_0[k]= Sum2 Aver_Bars;
In this example the position of the red line is the basis for the calculation of indicator array values for two other lines, i.e. their position on the chart. Dotted lines are calculated this way:
Line_1[k]= Line_0[k]+Up_Down*Point;
Line_2[k]= Line_0[k]-Up_Down*Point;
Use of index k for elements of all indicator arrays allows to perform calculations for elements of arrays Line_1[], Line_2[] on the same bar as used for calculating values of the corresponding basic array Line_0[]. As a result dotted lines are shifted relative to the red line by the value specified in the indicator settings window, in this case by 30 points (Fig. 124).
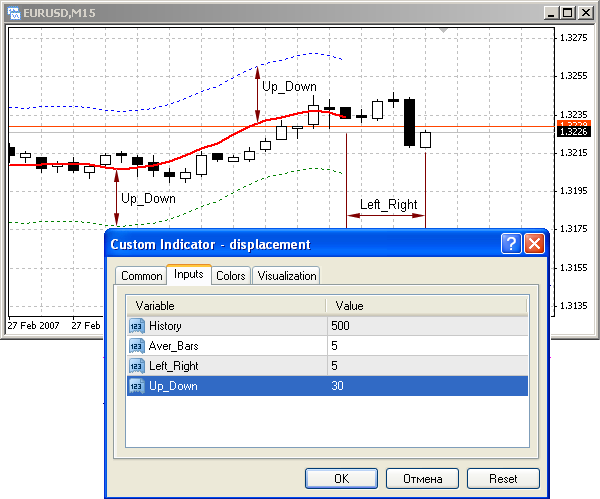
Fig. 124. Red indicator line is shifted to the left by 5 bars.
Dotted indicator lines are shifted relative to the red line by 30 points.
Limitations of Custom Indicators
There are some limitations in MQL4 that should be taken into account in the programming of custom indicators.
There is a group of functions that can be used only in custom indicators and cannot be used in Expert Advisors and scripts: IndicatorBuffers(),
IndicatorCounted (), IndicatorDigits(), IndicatorShortName(), SetIndexArrow(),
SetIndexBuffer(), SetIndexDrawBegin(), SetIndexEmptyValue(), SetIndexLabel(), SetIndexShift(),
SetIndexStyle(), SetLevelStyle(), SetLevelValue().
On the other hand, trade functions cannot be used in indicators: OrderSend(),
OrderClose(), OrderCloseBy(), OrderDelete() and OrderModify(). This is because indicators operate in the interface flow (as distinct from Expert Advisors and scripts that operate in their own flow).
This is also why algorithms based on looping cannot be used in custom indicators. Start of a custom indicator containing an endless loop (in terms of actual execution time) can result in client terminal hanging up with further necessity to restart a computer.
The general comparative characteristics of Expert Advisors, scripts and indicators is contained in Table 2.