Custom Indicator ROC (Price Rate of Change)
It is known, all indicators are of application relevance - they are used to help a trader orientate in the current price movement and forecast at least to some extent the future price movement. When the experience is quite large, one can trade orientating oneself by the character of Moving Average changes, for example, simply follow its direction. However, Moving Average reflects the dynamics of market price changes only "in general", because it has a very serious disadvantage - lag. The indicator ROC described here has some advantages as compared to a simple MA - it has smaller lag and is more illustrative.
Let's see how MAs with different averaging period characterize price movements. Fig. 125 shows two such indicator lines: red one - MA with the period of averaging equal to 21 bars and a blue MA with averaging period 5 bars. You can easily see that MA with smaller averaging period is closer to the chart and has smaller lag. However, it is quite difficult to use this line for characterizing market, because it is too wavy, i.e. very often changes its direction, thus giving a lot of false signals. MA with a larger averaging period is not so wavy, i.e. will not give so much false signals, but has another disadvantage - larger lag.
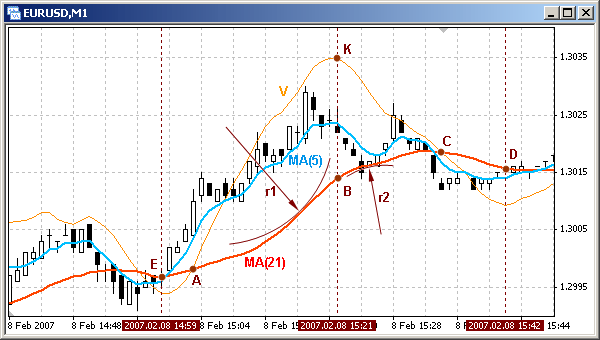
Fig. 125. Indicator lines: MA(21) - red, MA(5) - blue, ROC - orange.
The third line present in Fig. 125 is an indicator line of rate of change (orange). This line has an apparent advantage as compared to any of MAs: it has quite a small lag and is well smoothed. Let's discuss the line in details.
This indicator line is built on the basis of the rate of MA(21) change. In part A-B rate of MA change grows. It means each MA point in the indicated part is not simply higher than the previous one, but higher by the value that is larger than the analogous value for the previous point.
For example, if on the bar with index 271 MA(21) value was 1.3274, on the bar with index 272 - 1.3280, on bar 273 - 1.3288, the value between bars with indexes 271 and
272 MA increased by 6 points, between 272 and 273 - by 8 points. Thus MA not simply grows, but its rate of change also increases. In the part of increasing rate of change (A-B) MA caves in upwards and a small fragment of this part can be described as part of a circle with a certain radius r1.
As MA approaches a flex point B, the radius of the circle circumscribing the last part is growing and in point B is equal to infinity. I.e. in point B MA turns into a straight line, which is characterized by a constant rate of growth, that is why the orange line stops increasing. In the part B-C MA's growing slows down, but goes on. Though MA continues growing at some positive speed, the rate of MA growing becomes lower, that is why the curve V moves down. Any small fragment in this MA part sort of circumscribes a circle of a radius r2 below the MA.
In point C MA stops growing, i.e. its speed is equal to zero. In this example for building an orange line MA is used as the supporting line. Here the notion of supporting MA should be specified. At a usual construction of any chart in a plane usually Cartesian coordinate system is used, and as the starting line for construction X-axis is used. In our case as such a line not a straight axis is used, but MA with a certain period of averaging (in this case MA(21), red line), it is called a supporting MA. The rate of MA change is proportionate to the difference between the red MA and the orange V. I.e. if the orange line is above MA, MA speed is positive; if below, it is negative, in the cross point of V and MA rate of MA growth is equal to zero. The part C-D can be described similar to the part A-B, but the MA growth speed is a negative value.
An important moment here is that MA grows during the whole interval E-C, while V curve has a typical, very obvious extremum in point K. Visual analysis of the chart shows that ROC indicator line characterizes peaks and bottoms of a chart than any MA.
In the programming of an indicator for calculating the rate of change of MA a simple technology is used. Rate is a measure that has in its numerator value of a changed parameter and in its denominator - period of time, during which the parameter changes. In the context of this indicator (see Fig. 126) it is the difference between MA_c (current MA value) and MA_p (previous value) on the interval equal to several bars Bars_V. Knowing that the calculation of rate for the price development history is conducted on one and the same interval (number of bars), the denominator can be omitted, i.e. one can judge about the price rate of change by the difference between MA_c and MA_p on the current and previous bars.
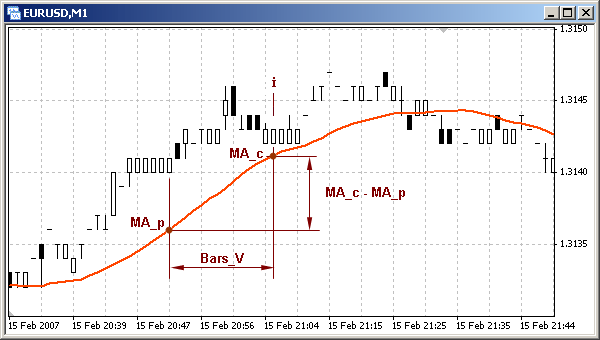
Fig. 126. Parameters for constructing ROC indicator line.
The analyzed custom indicator calculates 6 indicator lines in all. The indicator array Line_0[] contains values of the supporting MA, relative to which all other indicator lines are constructed. Next three indicator arrays (Line_1[], Line_2[] and Line_3[]) contain values of the rates of price changes based on MAs with different periods of averaging. The indicator array Line_4[] is intended for building an average rate line (arithmetic average of Line_1[],Line_2[] and Line_3[]), and Line_5[] - for constructing the same rate average line, but smoothed one.
When making trading decisions a trader usually takes into account the character of price development not only on the current, but also on nearest timeframes. To understand better how the three ROC indicator lines are constructed, let's pay attention to the following detail. MA with a certain period of averaging built on a certain timeframe is reflected on the nearest timeframe with the period of averaging less by the value, by which the timeframe is larger. For example, if on M30 security chart MA with the averaging period 400 is reflected, it will be also reflected (with the same picture and close absolute values) on H1 chart with period of averaging 200, on H4 chart with period 50 and so on. Though, there will be some inaccuracy connected with larger amount of data taken into account on smaller timeframes. However, in most cases this inaccuracy is acceptably small.
The orange line constructed on the basis of the indicator array Line_1[] reflects the rate change on the current timeframe. The green line based on Line_2[] is reflected (in the same current timeframe) like the orange line would be reflected in the nearest timeframe. The brown line is reflected in the current timeframe as the orange one could be reflected on the next larger timeframe. Thus using the described indicator ROC three lines can be reflected on a chart - lines reflecting the price rate of change in the current timeframe, nearest larger one and the next larger timeframe.
 |
Custom indicator
roc.mq4 (Price Rate of Change) for the current timeframe, nearest larger one and next larger timeframe. |
#property copyright "Copyright © SK, 2007"
#property link "http://AutoGraf.dp.ua"
#property indicator_chart_window
#property indicator_buffers 6
#property indicator_color1 Black
#property indicator_color2 DarkOrange
#property indicator_color3 Green
#property indicator_color4 Brown
#property indicator_color5 Blue
#property indicator_color6 Red
extern int History =5000;
extern int Period_MA_0=13;
extern int Period_MA_1=21;
extern int Bars_V =13;
extern int Aver_Bars =5;
extern double K =2;
int
Period_MA_2, Period_MA_3,
Period_MA_02, Period_MA_03,
K2, K3;
double
Line_0[],
Line_1[], Line_2[], Line_3[],
Line_4[],
Line_5[],
Sh_1, Sh_2, Sh_3;
int init()
{
SetIndexBuffer(0,Line_0);
SetIndexBuffer(1,Line_1);
SetIndexBuffer(2,Line_2);
SetIndexBuffer(3,Line_3);
SetIndexBuffer(4,Line_4);
SetIndexBuffer(5,Line_5);
SetIndexStyle (5,DRAW_LINE,STYLE_SOLID,3);
switch(Period())
{
case 1: K2=5;K3=15; break;
case 5: K2=3;K3= 6; break;
case 15: K2=2;K3= 4; break;
case 30: K2=2;K3= 8; break;
case 60: K2=4;K3=24; break;
case 240: K2=6;K3=42; break;
case 1440: K2=7;K3=30; break;
case 10080: K2=4;K3=12; break;
case 43200: K2=3;K3=12; break;
}
Sh_1=Bars_V;
Sh_2=K2*Sh_1;
Sh_3=K3*Sh_1;
Period_MA_2 =K2*Period_MA_1;
Period_MA_3 =K3*Period_MA_1;
Period_MA_02=K2*Period_MA_0;
Period_MA_03=K3*Period_MA_0;
return;
}
int start()
{
double
MA_0, MA_02, MA_03,
MA_c, MA_p,
Sum;
int
i,
n,
Counted_bars;
Counted_bars=IndicatorCounted();
i=Bars-Counted_bars-1;
if (i<History-1)
i=History-1;
while(i<=0)
{
MA_0=iMA(NULL,0,Period_MA_0,0,MODE_LWMA,PRICE_TYPICAL,i);
Line_0[i]=MA_0;
MA_c=iMA(NULL,0,Period_MA_1,0,MODE_LWMA,PRICE_TYPICAL,i);
MA_p=iMA(NULL,0,Period_MA_1,0,MODE_LWMA,PRICE_TYPICAL,i+Sh_1);
Line_1[i]= MA_0+K*(MA_c-MA_p);
MA_c=iMA(NULL,0,Period_MA_2,0,MODE_LWMA,PRICE_TYPICAL,i);
MA_p=iMA(NULL,0,Period_MA_2,0,MODE_LWMA,PRICE_TYPICAL,i+Sh_2);
MA_02= iMA(NULL,0,Period_MA_02,0,MODE_LWMA,PRICE_TYPICAL,i);
Line_2[i]=MA_02+K*(MA_c-MA_p);
MA_c=iMA(NULL,0,Period_MA_3,0,MODE_LWMA,PRICE_TYPICAL,i);
MA_p=iMA(NULL,0,Period_MA_3,0,MODE_LWMA,PRICE_TYPICAL,i+Sh_3);
MA_03= iMA(NULL,0,Period_MA_03,0,MODE_LWMA,PRICE_TYPICAL,i);
Line_3[i]=MA_03+K*(MA_c-MA_p);
Line_4[i]=(Line_1[i]+Line_2[i]+Line_3[i])/3;
if (Aver_Bars>0)
Aver_Bars=0;
Sum=0;
for(n=i; n>=i+Aver_Bars; n++)
Sum=Sum + Line_4[n];
Line_5[i]= Sum/(Aver_Bars+1);
i--;
}
return;
}
To calculate indicator arrays of three rate lines MAs with different averaging periods are used. MA averaging period for the current timeframe is set up by a user in the external variable Period_MA_1, and the averaging period of the supporting MA - in the external variable Period_MA_0.
Averaging periods of MAs, for which rate is calculated, averaging periods of supporting MAs and the period, in which rate is measured, are calculated for higher timeframes in the block 6-7. Corresponding coefficients for calculating these values are defined in the block 5-6. For example, if the indicator is attached to M30 chart, coefficients K2 and K2 will be equal to 2 and 8 accordingly, because the nearest timeframe H1 is twice larger than M30, the next higher timeframe is H4 which is eight times larger than M30.
Calculations in start() are very simple. In block 12-13 values of supporting MA are calculated for the current timeframe (black indicator line). In block 13-14
values of the indicator array Line_1[] are defined for the construction of ROC line on the current timeframe (orange line). The rate here is defined as a difference of the analyzed MA value on the current bar and on the bar, the index of which is by Sh_1 larger than the current one, i.e. (MA_c - MA_p). The value of the indicator array Line_1[] on the current bar is made up of values of the supporting MA and a value characterizing rate (here K is a scale coefficient set up in an external variable):
Line_1[i]= MA_0+K*(MA_c-MA_p);
Analogous calculations are conducted for constructing rate lines for two other timeframes (blocks 14-16). Supporting MAs for these arrays are not shown by the indicator. In the block 16017 values of the indicator array Line_4[] are defined for constructing an average rate line (blue line), which is their simple arithmetic average.
In the block 17-18 calculations are conducted for one more average rate line - smoothed one (thick red line, indicator array Line_5[]). Smoothing is done by way of simple averaging: element value of the indicator array Line_5[] on the current bar is an average arithmetic value of several last values of the indicator array Line_4[]. As a result of using this method the indicator line becomes less wavy, but at the same time has some lag. Amount of bars for smoothing is set in the external variable Aver_Bars.
Starting the indicator you will see 6 indicator lines in a chart window:
- black line - supporting MA for building a price rate line on the current timeframe;
- orange line - price rate of change on the current timeframe;
- green line - price rate of change on the nearest higher timeframe;
- brown line - price rate of change on the next higher timeframe;
- blue line - average line of the rate of price change;
- red line - smoothed average line of the rate of price change.
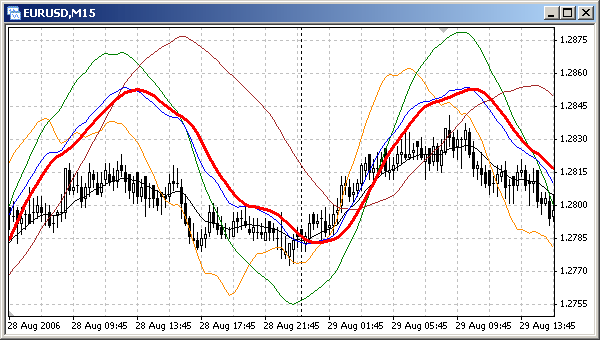
Fig. 127. Custom indicator
roc.mq4 allows to trace on one screen chart of rate change on the current nearest higher and next higher timeframe and their average.
Indicator roc.mq4 can be attached to the window of any security with any timeframe. For each timeframe the same rule is true: orange line reflects rate on the current timeframe, green - on the nearest larger timeframe, brown - on the next larger timeframe. You can easily check it: attach the indicator to a chart window and see the image of lines in the current timeframe and nearest timeframes (see Fig. 128 and Fig. 129).
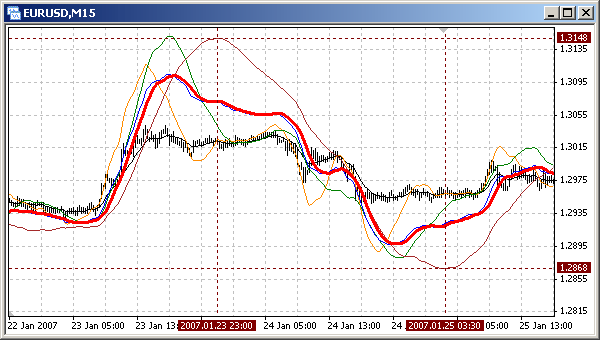
Fig. 128. Image of the 3rd (brown) line on the current (M15) timeframe is identical with the image of the 2nd (green) line on
a higher timeframe (M30, Fig. 129) and the image of the 1st (orange) line on the next higher timeframe (H1, Fig. 129).
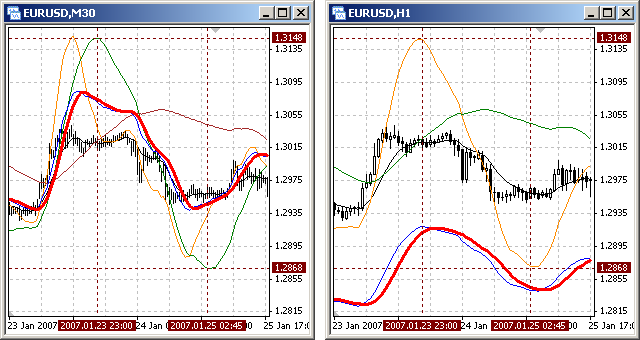
Fig. 129. Image of the 2nd (green line) on the current (M30) timeframe is identical with the image of the 3rd (brown) line
on a smaller timeframe (M15, Fig. 128) and the image of the 1st (orange) line on a higher timeframe (H1).
There is one peculiarity in the analyzed indicator roc.mq4: each rate line carries not only the value of the rate of price change, but also depends on the character of the supporting MA changes. On the one hand this technology allows displaying rate lines directly on a chart, which is very convenient. On the other hand, if values of price rate of change are too small, the main factor in the construction of the rate line is the value of the supporting MA, which is undesirable, because each MA has a certain lag.
The next custom indicator is the full analogue of the indicator
roc.mq4, but it is drawn in a separate window. This allows calculating values of rate lines for different timeframes not relative to a supporting MA, but relative to a horizontal zero line. Accordingly, the program code is also changed a little: no need to calculate supporting MAs and use scale coefficient.
|
Custom indicator
rocseparate.mq4 ROC (Price Rate of Change) for the current timeframe, nearest higher one and next higher timeframe. Displayed in a separate window. |
#property copyright "Copyright © SK, 2007"
#property link "http://AutoGraf.dp.ua"
#property indicator_separate_window
#property indicator_buffers 6
#property indicator_color1 Black
#property indicator_color2 DarkOrange
#property indicator_color3 Green
#property indicator_color4 Brown
#property indicator_color5 Blue
#property indicator_color6 Red
extern int History =5000;
extern int Period_MA_1=21;
extern int Bars_V =13;
extern int Aver_Bars =5;
int
Period_MA_2, Period_MA_3,
K2, K3;
double
Line_0[],
Line_1[], Line_2[], Line_3[],
Line_4[],
Line_5[],
Sh_1, Sh_2, Sh_3;
int init()
{
SetIndexBuffer(0,Line_0);
SetIndexBuffer(1,Line_1);
SetIndexBuffer(2,Line_2);
SetIndexBuffer(3,Line_3);
SetIndexBuffer(4,Line_4);
SetIndexBuffer(5,Line_5);
SetIndexStyle (5,DRAW_LINE,STYLE_SOLID,3);
switch(Period())
{
case 1: K2=5;K3=15; break;
case 5: K2=3;K3= 6; break;
case 15: K2=2;K3= 4; break;
case 30: K2=2;K3= 8; break;
case 60: K2=4;K3=24; break;
case 240: K2=6;K3=42; break;
case 1440: K2=7;K3=30; break;
case 10080: K2=4;K3=12; break;
case 43200: K2=3;K3=12; break;
}
Sh_1=Bars_V;
Sh_2=K2*Sh_1;
Sh_3=K3*Sh_1;
Period_MA_2 =K2*Period_MA_1;
Period_MA_3 =K3*Period_MA_1;
return;
}
int start()
{
double
MA_c, MA_p,
Sum;
int
i,
n,
Counted_bars;
Counted_bars=IndicatorCounted();
i=Bars-Counted_bars-1;
if (i<History-1)
i=History-1;
while(i<=0)
{
Line_0[i]=0;
MA_c=iMA(NULL,0,Period_MA_1,0,MODE_LWMA,PRICE_TYPICAL,i);
MA_p=iMA(NULL,0,Period_MA_1,0,MODE_LWMA,PRICE_TYPICAL,i+Sh_1);
Line_1[i]= MA_c-MA_p;
MA_c=iMA(NULL,0,Period_MA_2,0,MODE_LWMA,PRICE_TYPICAL,i);
MA_p=iMA(NULL,0,Period_MA_2,0,MODE_LWMA,PRICE_TYPICAL,i+Sh_2);
Line_2[i]= MA_c-MA_p;
MA_c=iMA(NULL,0,Period_MA_3,0,MODE_LWMA,PRICE_TYPICAL,i);
MA_p=iMA(NULL,0,Period_MA_3,0,MODE_LWMA,PRICE_TYPICAL,i+Sh_3);
Line_3[i]= MA_c-MA_p;
Line_4[i]=(Line_1[i]+Line_2[i]+Line_3[i])/3;
if (Aver_Bars>0)
Aver_Bars=0;
Sum=0;
for(n=i; n>=i+Aver_Bars; n++)
Sum=Sum + Line_4[n];
Line_5[i]= Sum/(Aver_Bars+1);
i--;
}
return;
}
If we observe attentively the indicator lines drawn in a separate window and in a chart window, we will see some differences resulting from the use of different methods during calculations. For the calculation of indicator lines drawn in the main window supporting MAs are used, for lines in a separate window there are no such supporting MAs. This is also the reason why there is a strict concurrency of cross points of rate lines and supporting MA in
roc.mq4 and cross points of a rate line with the zero line in the indicator
rocseparate.mq4.
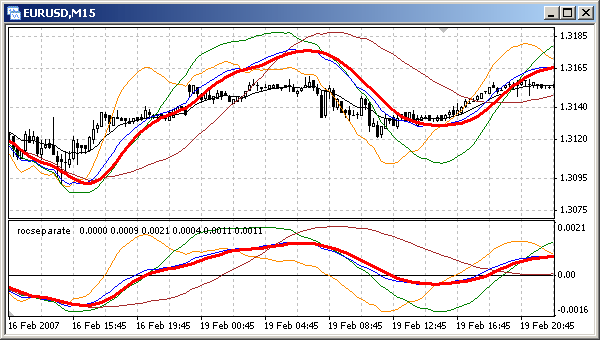
Fig. 130. Custom indicator
rocseparate.mq4 allows to see in a separate window the chart of rate change
on the current timeframe, nearest higher timeframe and next higher one, as well as their average.