Usage of Technical Indicators
According to belonging to the on-line trading system MetaTrader 4 there are two types of indicators in MQL4 - technical and custom.
Technical indicator is an integral part of the on-line trading system MetaTrader, built-in function that allows drawing on the screen a certain dependence.
Properties of Technical Indicators
Drawing in the Security Window
Each technical indicator calculates a certain predefined dependence. To draw this dependence graphically on the screen, a technical indicator should be attached to a chart. This can be done via the system menu Insert >> Indicators or via Navigator window of a client terminal. For attaching a technical indicator to a chart from Navigator window, a very simple method is used - drag-&-drop of the technical indicator name from Navigator window to a chart window. As a result one or several lines calculated in this indicator will appear in the chart window.

Fig. 104. Attachment of a technical indicator to a chart.
Indicator lines of a technical indicator may be drawn both in the main chart window and in a separate window in the lower part of a security window. In Fig. 104 technical indicator Alligator is drawn in a chart window.
Code Unchangeability
All technical indicators are built-in, their code is not available for making modifications. So a user is secured from an erroneous modification of built-in technical indicators. However, the source code, upon which a technical indicator is calculated, is available on the software developer website (MetaQuotes Ltd.) in the section Technical Indicators. If needed, a programmer may use the full code or part of it to create custom indicators (see Creation of Custom Indicators).
Calling Functions of Technical Indicators
Graphical representation visible to a user is displayed by a client terminal. Further for convenience we will call such drawings 'indicator lines'.
Indicator Line is a graphical display of a certain dependence based on numeric values included in an indicator array.
Indicator line type is set up by a user. Indicator line can be displayed in the form of a solid or dashed line, of a specified color, as well as in the form of a chain of certain signs (dots, squares, rings, etc.). During indicator calculations, sets of numeric values are calculated in it; indicator lines will be drawn in accordance with these calculations. These value sets are stored in indicator arrays.
Indicator Array is a one-dimensional array containing numeric values, in accordance with which indicator lines are constructed. Numeric values of indicator array elements are dots coordinates, upon which an indicator line is drawn. The Y-coordinate of each dot is the value of an indicator array element, X-coordinate is the index value of the indicator array element.
Data storing technology in indicator arrays is the basis of constructing technical and custom indicators. Values of indicator array elements of technical indicators are available from all application programs, including Expert Advisors, scripts and custom indicators. For getting a value of an indicator array element with a certain index in an application program it is necessary to call a built-in function, the name of which is set in accordance with a technical indicator name.
 |
For the execution of a technical indicator function the corresponding indicator should not be necessarily attached to a security window. Also technical indicator function call from an application program does not lead to the attachment of a corresponding indicator to a security window. Attachment of a technical indicator to a security window does not result in a technical indicator call in an application program either. |
A number of Technical indicators is included into the client terminal of the on-line trading system MetaTrader 4. Let's analyze some of them.
Moving Average, MA
Technical indicator Moving Average, MA shows the mean instrument
price value for a certain period of time. The indicator reflects the general market trend - can increase, decrease or show some fluctuations near some price.
For getting values of MA indicator line at a certain moment, use the standard function:
double iMA(string symbol, int timeframe, int period, int ma_shift, int ma_method, int applied_price, int shift)
Parameters:
symbol - symbol name of a security, on the data of which the indicator will be calculated. NULL means the current symbol.
timeframe - period. Can be one of chart periods. 0 means the period of the current chart.
period - period of averaging for MA calculations.
ma_shift - indicator shift relative to a price chart.
ma_method - method of averaging. Can be one of MA methods values.
applied_price - used price. Can be any of price constants.
shift - value index acquired from an indicator array (shift back relative to a current bar by a specified number of bars).
Below is an example of calling a technical indicator function from the Expert Advisor
callindicator.mq4 :
extern int Period_MA = 21;
bool Fact_Up = true;
bool Fact_Dn = true;
int start()
{
double MA;
MA=iMA(NULL,0,Period_MA,0,MODE_SMA,PRICE_CLOSE,0);
if (Bid > MA && Fact_Up == true)
{
Fact_Dn = true;
Fact_Up = false;
Alert("Price is above MA(",Period_MA,").");
}
if (Bid < MA && Fact_Dn == true)
{
Fact_Up = true;
Fact_Dn = false;
Alert("Price is below MA(",Period_MA,").");
}
return;
}
In the EA callindicator.mq4 iMA() function call is used (function of the technical indicator Moving Average). Let's analyze this program part in details:
MA=iMA(NULL,0,Period_MA,0,MODE_SMMA,PRICE_CLOSE,0);
NULL denotes that calculation of a moving average is done for a security window, to which the EA is attached (in this case it is EA, in general it can be any application program);
0 - it is calculated for the timeframe set in the security window, to which the EA is attached;
Period_MA - averaging period value is set in an external variable; if after attaching EA to a security window a user does not change this value in the settings of the EA external variables, the value is equal to 5;
0 - indicator array is not shifted relative to a chart, i.e. values of indicator array elements contain MA values calculated for bars, on which the indicator line is drawn;
MODE_SMA - method of a simple moving average is used for calculations;
PRICE_CLOSE - bar closing price is used for calculations;
0 - indicator array element index, for which the value is acquired - in this case it is zero element.
Taking into account that indicator array is not shifted relative to the chart, MA value is obtained for the zero bar. Function iMA() returns a value which is assigned to variable MA. In further program lines this value is compared with the the current Bid price. If the current price is higher or lower than the obtained MA value, an alert is displayed. Use of variables Fact_Up and Fact_Dn allows to show the alert only after the first crossing of MA line (note, the blue indicator line in a security window is drawn not because the technical indicator function was called from the program, but because a user has attached the indicator to the chart, Fig. 104).

Fig. 105. Result of callindicator.mq4 operation.
It should be noted here that with the appearance of new bars indexes of history bars increase, the currently being formed bar always has the 0 index. In the Expert Advisor
callindicator.mq4 the technical indicator function iMA() returns the value calculated for the zero bar. Though the index value is never changed during the EA execution (i.e. calculations are always conducted for on the current bar), the value returned by iMA() will always correspond to the last calculated, i.e. calculated for the current zero bar.
If for some calculations in the program we need to obtain the value of a technical indicator value not for the current bar, bur for a historic one, the necessary indicator array index should be specified in the function call. Let's view an example of EA historybars.mq4, in which MA is calculated on the fourth bar:
extern int Period_MA = 5;
int start()
{
double MA_c,
MA_p,
Delta;
MA_c = iMA(NULL,0,Period_MA,0,MODE_SMA,PRICE_CLOSE,0);
MA_p = iMA(NULL,0,Period_MA,0,MODE_SMA,PRICE_CLOSE,4);
Delta = (MA_c - MA_p)/Point;
if (Delta > 0 )
Alert("On 4 bars MA increased by ",Delta,"pt");
if (Delta < 0 )
Alert("On 4 bars MA decreased by ",-Delta,"pt");
return;
}
In the EA historybars.mq4 MA values are calculated for the current bar (index 0) and for the fourth bar (index 4). The indicated indexes 0 and 4 do not change during this program operation and the program can operate infinitely long each time calculating MA values for the zero and the fourth bars. Remember, though calculations are made for MA on bars with the same indexes, MA will be changed, i.e. will correspond to current MA values on the current zero bar and the current fourth bar.

Fig. 106. Result of historybars.mq4 operation.
In Fig. 106 it is clear that as prices grow on the las bars, MA goes up. The difference between MA values on the zero and the fourth bars also grows which is reflected in the displayed alerts.
Technical indicators may reflect not only one, but also two or more indicator lines
Stochastic Oscillator
Technical indicator Stochastic Oscillator compares the current closing price with the price range for a selected period of time. The indicator is usually represented by two indicator lines. The main one is called %K. The second %D signal line is the moving average of %K. Usually %K is drawn as a solid line, %D - dashed. According to one of the indicator explanation variants, we should buy if %K is higher than %D and sell if %K goes lower than %D. The most favorable moment for executing a trade operation is considered to be the moment of concurrence of lines.
double iStochastic(string symbol, int timeframe, int %Kperiod, int %Dperiod, int slowing, int method, int price_field,
int mode, int shift)
Parameters:
symbol symbol name of a security, on the data of which the indicator will be calculated. NULL means the current symbol.
timeframe - period. Can be one of chart periods. 0 means the period of the a current chart.
%Kperiod - period (number of bars) for calculating %K.
%Dperiod - period of averaging of %D.
slowing - value of slowing.
method - method of averaging. Can be one of MA methods values.
price_field - parameter of choosing prices for calculations. Can be one of the following values: 0 - Low/High or 1 - Close/Close.
mode - index of indicator lines. Can be one of the following values: MODE_MAIN or MODE_SIGNAL.
shift - index of the obtained value from an indicator buffer (shift back relative to a current bar by a specified number of bars).
Using Stochastic Oscillator offers the necessity of analyzing the relative lines positions. For calculating what trade decision should be performed, the value of each line on the current and previous bars must be taken into account (see Fig. 107). When lines cross in the point A (green line crosses the red one upwards), Sell order should be closed and Buy order should be opened. During the part A - B (no lines crossing, green line is higher than the red line) Buy order should be held open. In point B (green line crosses the red one downwards) Buy should be closed and Sell should be opened. Then Sell should stay open till the next crossing (no crossing, green line below the red line).
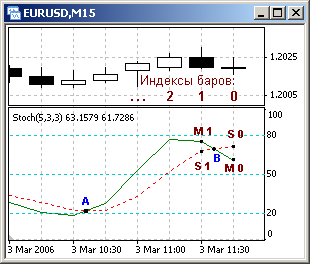
Fig. 107. Concurrence of the main and the signal lines of Stochastic Oscillator.
The next example contains the implementation of a simple algorithm that demonstrates how necessary values of each line can be obtained and trading criteria can be formed. For this purpose values of technical indicator functions iStochastic() are used in the EA
callstohastic.mq4:
int start()
{
double M_0, M_1,
S_0, S_1;
M_0 = iStochastic(NULL,0,5,3,3,MODE_SMA,0,MODE_MAIN, 0);
M_1 = iStochastic(NULL,0,5,3,3,MODE_SMA,0,MODE_MAIN, 1);
S_0 = iStochastic(NULL,0,5,3,3,MODE_SMA,0,MODE_SIGNAL,0);
S_1 = iStochastic(NULL,0,5,3,3,MODE_SMA,0,MODE_SIGNAL,1);
if( M_1 < S_1 && M_0 >= S_0 )
Alert("Crossing upwards. BUY.");
if( M_1 > S_1 && M_0 <= S_0 )
Alert("Crossing downwards. SELL.");
if( M_1 > S_1 && M_0 > S_0 )
Alert("Continue holding Buy position.");
if( M_1 < S_1 && M_0 < S_0 )
Alert("Continue holding Buy position.");
return;
}
For obtaining %K line value (solid green) on the zero bar, the following calculation line is used:
M_0 = iStochastic(NULL,0,5,3,3,MODE_SMA,0,MODE_MAIN, 0);
Here parameter MODE_MAIN indicates the line, the value of which is asked, the last parameter 0 is the bar index, for which the line value should be calculated. In the three following program lines other variables are calculated by analogy - for %D line (red dashed line, parameter MODE_SIGNAL) for the zero and the first bar.
In the next block the correlation of obtained values is analyzed and the EA reports about the current state on each tick. For example, in lines:
if( M_1 < S_1 && M_0 >= S_0 )
Alert("Crossing upwards. BUY.");
the fact of a red line's being crossed by the green one upwards is detected. If on the previous bar the green line was below the red one (i.e. the expression M_1 < S_1 is true), and on the current bar the green line rises above the red one or their values are equal (i.e. the expression M_0 >= S_0 is true),
it means that from the previous bar formation to the current moment the green lone crossed the red one upwards. Thus condition calculated in 'if' operator is true, that is why control is passed to 'if' operator body, as a result Alert() is executed to show the corresponding message.
In an Expert Advisor intended for trading in 'if' operator body a trading function for opening a Buy order should be indicated. In this case the analyzed variant of indicator lines' crossing will lead to the formation of a trade order and, finally, to the execution of a trade operation. For the variant when the green line crosses the red one downwards, in 'if' body a trade function for opening a Sell order should be indicated.
Fig. 108 shows the result of callstohastic.mq4 operation.

Fig. 108. Result of callstohastic.mq4 operation
Using functions of technical indicators to create trading Expert Advisors and scripts is very convenient. Amount of technical indicator functions used in one Expert Advisor is unlimited. A trading strategy developer may decide to define different trading criteria based on the combination of technical indicator values. Example of a simple trading Expert Advisor, trading criteria of which are based on technical indicators, is analyzed in the section Simple Expert Advisor.