Custom Indicators
The functions of custom indicators allow you to adjust the necessary settings to make a convenient representation of an indicator. Let's consider some of them (see also Creation of Custom Indicators).
SetIndexBuffer() Function
bool SetIndexBuffer(int index, double array[])
The function joins an array-variable that was declared on the global level with a predestined custom indicator buffer. The amount of buffers that are necessary for indicator computation is set using the IndicatorBuffers() function and cannot exceed 8. In case of successful connection, TRUE is returned, otherwise - FALSE. In order to get the detailed information about an error you should call the GetLastError() function.
Parameters:
index - index number of a line (from 0 to 7 values are possible);
array[] - a name of the array that is connected with a calculation buffer.
SetIndexStyle() Function
void SetIndexStyle(int index, int type, int style=EMPTY, int width=EMPTY, color clr=CLR_NONE)
The function sets a new type, style, width and color of a specified line of indicator.
Parameters:
index - index number of a line (from 0 to 7 values are possible);
type - indicator line type. Can be one of the listed types of indicator lines (see Styles of Indicator Lines Displaying);
style - line style. Used for the lines of 1 pixel width. Can be one of the line styles specified in the Styles of Indicator Lines Displaying appendix. The EMPTY value specifies that the style won't be changed;
width - line width; permissible values are - 1,2,3,4,5; the EMPTY value specifies that the width won't be changed;
clr - line color. The empty value CLR_NONE means that the color won't be changed.
SetIndexLabel() Function
void SetIndexLabel(int index, string text)
The function allows to set an indicator line name to be displayed in DataWindow and in the pop-up tip.
Parameters:
index - index number of a line (from 0 to 7 values are possible);
text - a text describing an indicator line. NULL means that the value of a line is not shown in DataWindow.
The example of the simple indicator showing High line (indicatorstyle.mq4) that uses the functions described above:
#property indicator_chart_window
#property indicator_buffers 1
#property indicator_color1 Blue
double Buf_0[];
int init()
{
SetIndexBuffer(0,Buf_0);
SetIndexStyle (0,DRAW_LINE,STYLE_SOLID,2);
SetIndexLabel (0,"High Line");
return;
}
int start()
{
int i,
Counted_bars;
Counted_bars=IndicatorCounted();
i=Bars-Counted_bars-1;
while(i>=0)
{
Buf_0[i]=High[i];
i--;
}
return;
}
Block 1-2 contains general settings of an indicator. It is specified with the #property command that the indicator must be drawn in the main window, the indicator uses one buffer, the color of the indicator line is blue. One buffer array is opened in block 1-2, as well.
The functions specified above are used in block 2-3. The entry:
SetIndexBuffer(0,Buf_0);
assigns the buffer named Buf_0 to the buffer with the 0 index. The entry:
SetIndexStyle (0,DRAW_LINE,STYLE_SOLID,2);
determines the style of indicator line that has the 0 index. The DRAW_LINE constant indicates that the line displayed is simple, the STYLE_SOLID constant indicates that the line is solid, and 2 specifies the width of the line. The entry:
SetIndexLabel (0,"High Line");
assigns the name to the indicator line with the 0 index. The specified name can be seen in the DataWindow and in the balloon tip in the window of financial instrument (fig. 810_3). The naming of the lines is convenient, if the window contains a number of indicator lines; sometimes it is the only way to distinguish one line from another. Block 3-4 performs the calculation of the values of indicator array elements for the line that is used to display the maximum values of bars (the sequence of indicator arrays calculation is described in the Creation of Custom Indicators section in detail).
If the indicator is displayed in a separate window, then the horizontal levels can be displayed in this window too.
SetLevelValue() Function
void SetLevelValue(int level, double value)
Sets the value for the specified horizontal level of the indicator that is displayed in a separate window.
Parameters:
level - level number (0-31).
value - a value for the specified level.
The use of horizontal levels can be very convenient, if you need to detect visually whether the indicator line is above or below the specified values. The simple indicator that calculates the difference between the maximum and the minimum price of the bar is shown below. The market events are interesting for the user (tentatively in this example) if the indicator line is above the bar by 0.001 or below the bar by -0.001. The example of the indicator that displays the difference between High and Low (linelevel.mq4):
#property indicator_separate_window
#property indicator_buffers 1
#property indicator_color1 Red
double Buf_0[];
int init()
{
SetIndexBuffer(0,Buf_0);
SetIndexStyle (0,DRAW_LINE,STYLE_SOLID,2);
SetIndexLabel (0,"High/Low Difference");
SetLevelValue (0, 0.0010);
SetLevelValue (1,-0.0010);
return;
}
int start()
{
int i,
Counted_bars;
Counted_bars=IndicatorCounted();
i=Bars-Counted_bars-1;
while(i>=0)
{
Buf_0[i]=High[i]-Low[i];
if(Open[i]>Close[i])
Buf_0[i]=-Buf_0[i];
i--;
}
return;
}
The considered function is used in block 2-3 in the indicator. In this case, two horizontal levels are specified. The first value in the list of parameters is the number of the horizontal level, the second one is the specified value of the level:
SetLevelValue (0, 0.0010);
SetLevelValue (1,-0.0010);
The parameters of indicatorstyle.mq4 and linelevel.mq4 indicators set in such a way are displayed in the window of the financial instrument and in the DataWindow.
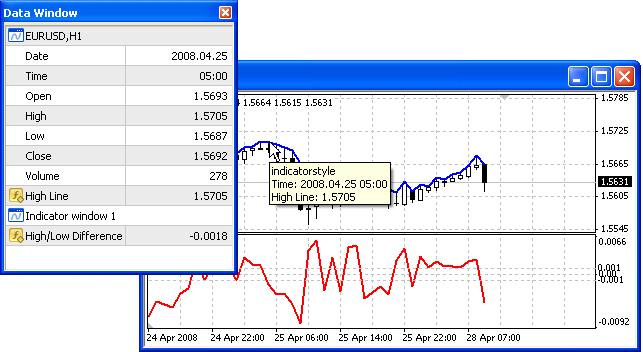
Fig. 154. Displaying indicators settings in different windows of the client terminal.
Two windows - the DataWindow and the financial instrument window are shown in the fig. 154. You can see the entry containing "High Line" text and the 1.3641 value in the DataWindow. The same inscriptions are shown in the lower entry of the pop-up tip.
The said entry is displayed in the DataWindow the whole time the indicator runs, the name of the line is not changed at that, but the value in the right part of the entry depends on the cursor position in the financial instrument window. The name of the line that is shown in the pop-up tip corresponds to the indicator line the cursor is pointed at.
The subwindow of the linelevel.mq4 indicator contains the horizontal lines that are placed according to the user-set values. If you move the cursor over the red indicator line then the name of this line, in this case the "Difference between High and Low", can be seen in the pop-up tip, the value at the cursor point can be seen to the right of the name.
Functions for Adjusting Custom Indicators
| Function |
Summary Info
|
|---|
| IndicatorBuffers |
It arranges the memory of buffers that are used for calculating a custom indicator. The amount of buffers cannot exceed 8 and must be less than the value specified in the #property indicator_buffers command. If the custom indicator needs more buffers for calculation, you should use this function to specify the whole number of buffers. |
| IndicatorCounted |
The function returns an amount of bars that were not changed since the last indicator launch. The majority of bars do not require recalculation. |
| IndicatorDigits |
It sets the accuracy (the number of symbols after the decimal point) for visualization of indicator values. |
| IndicatorShortName |
It sets a "short" name to an indicator to be displayed in the indicator's subwindow and in the DataWindow. |
| SetIndexArrow |
It sets a symbol to an indicator line that has the DRAW_ARROW style. |
| SetIndexBuffer |
It joins an array-variable that is declared on the global level with a specified buffer of a custom indicator. |
| SetIndexDrawBegin |
It sets an index number from the beginning of data to the bar the drawing of a specified indicator should begin with.
|
| SetIndexEmptyValue |
It sets an empty value for indicator line. Empty values are not drawn and are not shown in the DataWindow. |
| SetIndexLabel |
It sets a name of an indicator line to display the information in the DataWindow and in the balloon tip. |
| SetIndexShift |
It sets a shift for an indicator line relatively to the chart beginning. The positive value will shift a line to the right, the negative value - to the left. I.e. the value calculated on the current bar is drawn with the specified, relative to the current bar, shift. |
| SetIndexStyle |
It sets a new type, style, width and color for a specified indicator line (see Styles of Indicator Lines Displaying). |
| SetLevelStyle |
It sets a new style, width and color for horizontal levels of an indicator that is displayed in a separate window (see Styles of Indicator Lines Displaying). |
| SetLevelValue |
It sets a value for specified horizontal level of an indicator that is displayed in a separate window. |
To get the detailed information about these and other functions, please refer to the Documentation at MQL4.community, at MetaQuotes Ltd. website or at the "Help" section of the MetaEditor.