MQL4 Book
![]() Standard Functions
Standard Functions
![]() Graphical Objects
Graphical Objects
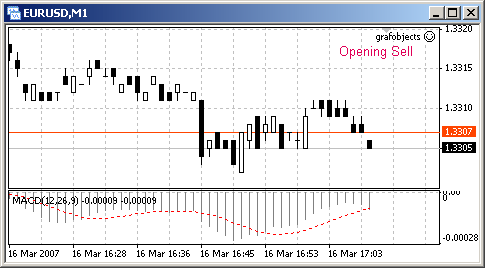
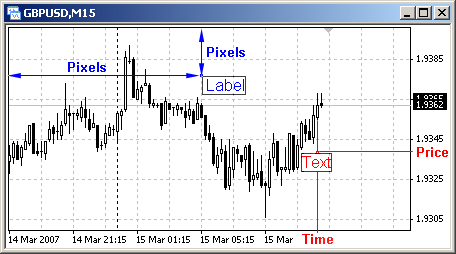
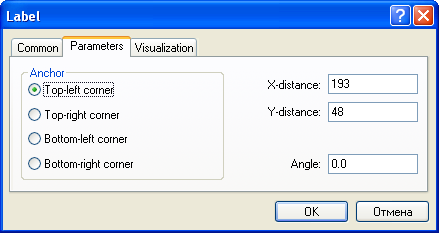
MACD is very often used by traders for the formation of trading criteria. The indicator is represented by two lines - main and signal. A trading criteria is considered to be realized when the lines cross. If the main indicator line (usually gray histogram) crosses the signal line (usually red dotted line) downwards, this is a signal to sell, id upwards - to buy. In intervals between line crossing market orders should be held open, and when a contrary criterion triggers, the orders should be closed and opposite once opened. Thus four message types should be prepared: opening of Buy, opening of Sell, holding of Buy, holding of Sell. In this problem all messages are mutually exclusive, i.e. the situation when two or more messages should be shown is impossible. That is why in this case one graphical object can be used; the object will be always present on th screen, but it will be changed from time to time. Let us draw this object in the upper right corner of the window, in which the EA will operate. Since the object position should not be changed, it is convenient to use an object of OBJ_LABEL type, because it is positioned relative to a chart window. As a solution of Problem 32 let us view the EA grafobjects.mq4 using the graphical object OBJ_LABEL: //-------------------------------------------------------------------- In the EA block 1-2 parameters are defined, in particular element values of Text[] and Color[] are set. Further they are used for changing object properties. In the block 2-3 the object is created and values of some its properties are set. Let us analyze this block in details. According to this EA code line a graphical object is created in the window, in which the EA is executed: ObjectCreate("Label_Obj_MACD", OBJ_LABEL, 0, 0, 0);// Creating obj. "Label_Obj_MACD" value denotes that this name is assigned to the object (a name is assigned to an object by a programmer in his own discretion). OBJ_LABEL - is the object type identifier; it denotes that the created object will be of exactly this type (chosen from the list of possible types). The first of the next three zeros denotes that the object is created in the main window (the main window where the chart is displayed, always has the index 0). The next two zeros set coordinates for the created object. According to this coordinated the object will be drawn in the indicated window. In this case the created OBJ_LABEL does not use time and price coordinates. Please note that in OjectCreate() description only time and price coordinates are specified. Moreover, coordinates of the second and the third pairs have default values, while there are no default values for the first pair of coordinates. It means that though OBJ_LABEL does not need time and price coordinates at all, some values must be specified in ObjectCreate() function call. In this case zeros are indicated, though any other values can be written - anyway these values will be neglected during the setup of OBJ_LABEL properties. In the next three lines some property values are set to the earlier created object named Label_Obj_MACD: ObjectSet("Label_Obj_MACD", OBJPROP_CORNER, 1); // Reference corner For the reference corner (OBJPROP_CORNER) 1 is set, which means the upper right corner of the earlier defined main window. In the next two lines distances from the object to a reference corner are set on pixels: horizontal distance (OBJPROP_XDISTANCE) 10 pixels and vertical distance (OBJPROP_YDISTANCE) 15 pixels. At this program execution stage the object is already created, has its unique name and defined main properties. To make the object show a necessary text, first we need to calculate what this text should look like. For this purpose first in block 3-4 the position of MACD lines is detected on the current and previous bars, then in block 4-5 Sit value corresponding to the current situation is calculated (see also Fig. 107 and callstohastic.mq4) In the next line object properties depending on the current situation are defined: // Changing object properties As a result of ObjectSetText() execution a text description is assigned to the object named Label_Obj_MACD - the value of the string variable Text[Sit]. This value will be different for different situations depending on values of Sit variable. For example, if the main line crosses the signal one downwards, in block 4-5 Sit gets the value 1, as a result the graphical object will get the text description contained in the Text[1] array element, i.e. "Opening of Sell". Other parameters: 10, "Arial" and Color[Sit] denote font size, name and color for the text description. As a result of the EA execution the following will appear in EURUSD window:
In Fig. 137 there is a main window and MACD subwindow. It should be noted here that for a normal EA operation presence of this indicator on the symbol window is not necessary, because trading criteria in the EA are calculated as a result of a technical indicator function execution which is not connected with the indicator displaying. Here the indicator is shown only for visual explanation of the moment of a trading criterion triggering when the necessary text description of the graphical object is shown. The EA will operate in the similar way at all other combinations of the mutual position of indicator lines each time showing a description corresponding to a situation. Deleting Graphical ObjectsThe analyzed Expert Advisor grafobjects.mq4 has a small disadvantage. After the EA stops operating, a graphical object will remain in the chart window (his properties will remain the same as at t he moment of its last change). Graphical objects are not deleted automatically. In course of trading starting from a certain moment the message "Opening of Sell" will not be valid. In order not to misinform a user the graphical object must be deleted. For deleting a graphical object (irrespective of its creation method - programmed or manual) simply select it and press the Delete key. However, as for programming, it should be noted that a correctly written program must "clear" the window when its operation is over. In other words, a program should contain a block where all graphical objects created by the program are deleted. ObjectDelete() Function
|
| Problem 33. Create a program (an Expert Advisor) supporting the drawing of a linear regression channel for the last 50 bars. |
The graphical object "linear regression channel" uses two time coordinates. Price coordinates (if such are specified in the program) are neglected by the client terminal during the object construction. The linear regression channel is calculated by the client terminal based on historic price data and therefore cannot be displayed aside from a chart. That is why the absence of the object binding to price (ignoring of price coordinates by the terminal) is the object's own constant property. Th Expert Advisor (moveobjects.mq4) managing the position of a graphical object can have the following code:
//--------------------------------------------------------------------
// moveobjects.mq4
// The code should be used for educational purpose only.
//--------------------------------------------------------------------
extern int   Len_Cn=50;                // Channel length (bars)
extern color Col_Cn=Orange;            // Channel color
//--------------------------------------------------------------- 1 --
int init()                             // Special function init()
  {
   Create();                           // Calling user-def. func. of creation
   return;                             // Exit init()
  }
//--------------------------------------------------------------- 2 --
int start()                            // Special function start()
  {
   datetime T2;                        // Second time coordinate
   int Error;                          // Error code
//--------------------------------------------------------------- 3 --
   T2=ObjectGet("Obj_Reg_Ch",OBJPROP_TIME2);// Requesting t2 coord.
   Error=GetLastError();               // Getting an error code
   if (Error==4202)                    // If no object :(
     {
      Alert("Regression channel is being managed",
            "\n Book_expert_82_2. deletion prohibited.");
      Create();                        // Calling user-def. func. of creation
      T2=Time[0];                      // Current value of t2 coordinate
     }
//--------------------------------------------------------------- 4 --
   if (T2!=Time[0])                    // If object is not in its place
     {
      ObjectMove("Obj_Reg_Ch", 0, Time[Len_Cn-1],0); //New t1 coord.
      ObjectMove("Obj_Reg_Ch", 1, Time[0],       0); //New t2 coord.
      WindowRedraw();                  // Redrawing the image
     }
   return;                             // Exit start()
  }
//--------------------------------------------------------------- 5 --
int deinit()                           // Special function deinit()
  {
   ObjectDelete("Obj_Reg_Ch");         // Deleting the object
   return;                             // Exit deinit()
  }
//--------------------------------------------------------------- 6 --
int Create()                           // User-defined function..
  {                                    // ..of object creation
   datetime T1=Time[Len_Cn-1];         // Defining 1st time coord.
   datetime T2=Time[0];                // Defining 2nd time coord.
   ObjectCreate("Obj_Reg_Ch",OBJ_REGRESSION,0,T1,0,T2,0);// Creation
   ObjectSet(   "Obj_Reg_Ch", OBJPROP_COLOR, Col_Cn);    // Color
   ObjectSet(   "Obj_Reg_Ch", OBJPROP_RAY,   false);     // Ray
   ObjectSet(   "Obj_Reg_Ch", OBJPROP_STYLE, STYLE_DASH);// Style
   ObjectSetText("Obj_Reg_Ch","Created by the EA moveobjects",10);
   WindowRedraw();                     // Image redrawing
  }
//--------------------------------------------------------------- 7 --
The moveobjects.mq4 EA algorithm implies that an object attached once will remain on the screen during the whole time of the program execution. In such cases it is reasonable to use a user defined function (in this case it is Create(), block 6-7) for an object creation, the function can му called from the program anytime when needed. To draw an object two time coordinates are necessary (T1 is the coordinate of the object's left border, T2 - that of the right border):
   datetime T1 = Time[Len_Cn-1];       // Defining 1st time coord.
   datetime T2 = Time[0];              // Defining 2nd time coord.
In this example the right border of the object must always be on the zero bar, that is why the value of the second coordinate corresponds to the opening time of the zero bar. The left coordinate is calculated according to the number of bars set by a user (external variable Len_Cn) and is defined as the opening time of a bar with the corresponding index. For example, if the channel length is 50 bars, the left coordinate will be equal to the opening time of a bar with the index 49.
In the next lines of the user-defined function Create() the OBJ_REGRESSION object is created using ObjectCreate(), then necessary properties of the created object are set up by the ObjectSet() function (color preset by a user in an external variable, prohibited to draw as a ray, line style - dotted). In the line:
ObjectSetText("Obj_Reg_Ch","Created by the EA moveobjects",10);
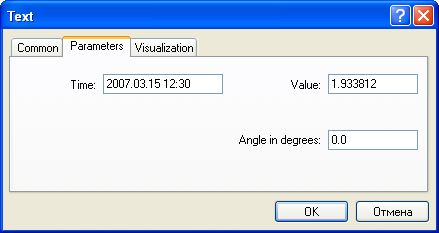
a text description is assigned to the object. As distinct from the earlier analyzed OBJ_LABEL, the text description of OBJ_REGRESSION is not displayed. The text description of graphical objects can be viewed in the object properties tab. This is very convenient in practical application for differentiating between objects created in a program way from those attached manually:
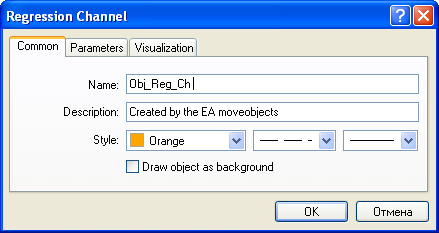
Fig. 138. Common properties of the graphical object "linear regression channel" created by the EA moveobjects.mq4.
Here is one more function used for redrawing of the current chart:
WindowRedraw(); // Image redrawing
void WindowRedraw()
The function forcibly redraws the current chart. Usually it is used after object properties are changed.
Normally, the graphical objects are displayed by the client terminal in the sequence of incoming of new ticks. This is why, if we don't use WindowRedraw(), the changes in the object properties become visible to the user at the next tick, i.e., the displaying is always one tick late. The use of WindowRedraw() allows you to forcibly redraw all objects at a necessary moment, for example, immediately after the object properties have been changed. In a general case, if the properties of several objects are changed in the program, it is sufficient to use the function WindowRedraw() only once, after the properties of the last of the objects have been changed.
The user-defined function is first called from the special function init(). At the moment of attaching the EA to the symbol window, the execution of init() will start, which results in that the graphical object Linear Regression Channel will be displayed in the symbol window.
Two possible situations are considered in the function start(): (1) the object has been occasionally deleted by the user (block 3-4) and (2) it is necessary to move the object to the right when a new zero bar is formed (block 4-5). To detect whether the graphical object is available at the current moment, it is sufficient just to request the value of one of its coordinates. If the object exists, the function ObjectGet() will return a certain value that corresponds with the requested coordinate and the function GetLastError() will return zero value (i.e., no error occurred when requesting the coordinate). However, if there is no object of the given name in the symbol window, the function GetLastError() will return the code of error 4202, i.e., no object available:
   T2=ObjectGet("Obj_Reg_Ch",OBJPROP_TIME2);     // Requesting t2 coord.
   Error=GetLastError();                         // Getting an error code
If the error analysis showed that there were no object of that name, it means the program must create it, having notified the user about inadmissible actions (the program doesn't delete objects, it means that the object has been deleted by the user). This is why, after having displayed the message, the program calls to the previously considered user-defined function Create(), which results in a new creation of the object in the symbol window.
By the moment of the execution of the next block (4-5), the graphical object has already been created. To decide whether it must be moved, you should know the position of the object at the current moment. For this purpose, it is sufficient to analyze the previously obtained value of the first coordinate of the object. If this value doesn't coincide with the time of opening zero bar, to assign new coordinates to the object.
The coordinates are changed using the function ObjectMove():
   ObjectMove("Obj_Reg_Ch", 0, Time[Len_Cn-1],0); //New t1 coord.
   ObjectMove("Obj_Reg_Ch", 1, Time[0],       0); //New t1 coord.
Here, for the first coordinate (coordinate 0) of the object named Obj_Reg_Ch, the value of Time[Len_Cn-1] will be set, whereas for the second coordinate (coordinate 1) -Time[0]. The last parameters among those transferred to the function ObjectMove() is specified the parameter 0. This is the coordinate of the price that, according to the function description, must be transferred, but, in this case, will be ignored by the client terminal. As a result of execution of these lines, the properties of the considered graphical object will be changed. As a result of the next execution of the function WindowRedraw(), the graphical object will be forcibly redrawn by the client terminal - now according to the new values of the coordinates.
Thus, at the execution of the function start(), the graphical object Linear Regression Channel will be redrawn by the client terminal each time when a new bar forms, at its very first tick (see Fig. 139). After the execution of the EA has ended, the given graphical object will be deleted from the symbol window during execution of the special function deinit() (i.e., the program will "sweep out" its working place after the work has been finished).
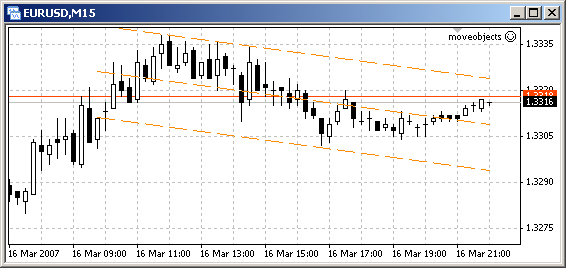
Fig. 139. Displaying of the Linear Regression Channel at the execution of the EA
moveobjects.mq4.
In a general case, you can create and delete graphical objects according to some conditions calculated in the program. You can display the support/resistance lines (OBJ_TREND), mark the time of approaching important events with vertical lines (OBJ_VLINE), indicate the intersections of various lines or the forecast price movements using text objects (OBJ_LABEL and OBJ_TEXT), etc.
It must be noted separately that, in a number of cases, there is no need to use graphical objects. For example, if you want to display in the screen a great variety of simple one-type images (for example, arrows), you can use indicator lines for this, having set their styles in the corresponding way. This approach will free you from the necessity to track many coordinates of objects in the program, it will also prevent you from occasional deletion of an image (the signs that display indicator lines can be neither selected nor deleted).
| Function | Summary Info |
|---|---|
| ObjectCreate | Creating an object with predefined name, type and initial coordinates in the indicated chart subwindow. number of object coordinates can be from 1 to 3 depending on the object type. In case of success the function returns TRUE, otherwise FALSE. |
| ObjectDelete | Deleting an object with the indicated name. In case of success the function returns TRUE, otherwise FALSE. |
| ObjectDescription | The function returns the object description. It returns for objects of the OBJ_TEXT and OBJ_LABEL types the text displayed in these objects. |
| ObjectFind | The function searches for the object of the given name. The function returns the index of the window, to which the searched object belongs. In case of failure, the function returns -1. |
| ObjectGet | The function returns the value of the given property of the object. |
| ObjectGetFiboDescription | The function returns the description of the Fibo object level. The amount of levels depends on the type of the object that belongs to the group of Fibo objects. The maximum amount of levels is 32. |
| ObjectGetShiftByValue | The functions calculates and returns the bar number (the shift relative to the current bar) for the given price. The bar number is calculated using a linear equation for the first and second coordinates. It is used for trend lines and similar objects. |
| ObjectGetValueByShift | The functions calculates and returns the price value for the given bar (the shift relative to the current bar). The price value is calculated using a linear equation for the first and second coordinates. It is used for trend lines and similar objects. |
| ObjectMove | Changing one of object coordinates on a chart. Objects can have from one to three anchoring points according to the object type. In case of success, the function returns TRUE, otherwise FALSE. |
| ObjectName | The function returns the object name according to its order number in the list of objects. |
| ObjectsDeleteAll | Deleting all object of the indicated type in the indicated chart subwindow. The function returns the number of deleted objects. |
| ObjectSet | Changing properties of an indicated object. In case of success the function returns TRUE, otherwise FALSE. |
| ObjectSetFiboDescription | The function assigns a new value to Fibonacci level. Number of levels depends on Fibonacci object type. Maximal number of levels is 32. |
| ObjectSetText | Changing object description. For objects OBJ_TEXT and OBJ_LABEL this description is displayed on a chart as a text line. In case of success the function returns TRUE, otherwise FALSE. |
| ObjectsTotal | Returns the total number of objects of the indicated type on a chart. |
| ObjectType | The function returns the type of an indicated object. |
For the detailed description of these and other functions, please refer to Documentation at MQL4.community, MetaQuotes Ltd. website or to "Help" section in MetaEditor.
 -
-